Riding the Metrics: Public Transit Performance in Virginia
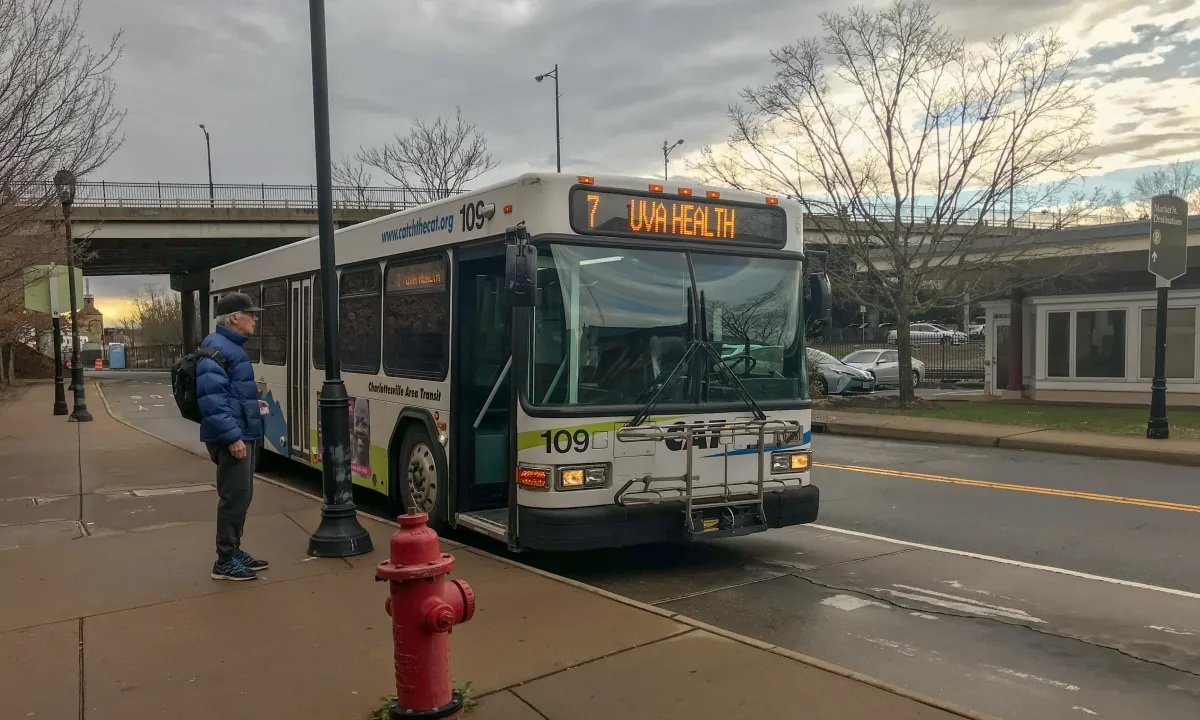
Public transit plays a vital role in connecting communities, reducing congestion, and mitigating environmental impact from transportation [1]. Transit agencies like Charlottesville Area Transit (CAT) use performance metrics to track their effectiveness and efficiency, while state governments rely on these metrics to allocate proportionate shares of annual state and federal grants to each agency.
This blog post is the first in a series that dives into competitive and formula funding for transit in Virginia. In this series, we’ll show how key indicators, such as ridership and operating costs, relate to each other in determining agencies’ ability to compete for State and Federal funding streams. With the insight of transit agency leaders, we consider lessons that Charlottesville and Albemarle County’s transit services can learn from their peers competing for the same pots of money.
Join us this week as we look at CAT’s ridership performance in comparison with fellow Virginian transit agencies in Blacksburg, the Greater Richmond Area and Arlington, and as we ask their decision-makers: what drives successful public transportation systems?
Ridership
Before we get into the comparative, we have to take stock of where we are now, starting with one important metric: ridership. Data is a great storyteller. While ridership is by no means the only significant health indicator of a transit agency, tracking ridership trends over time can tell the story of how well an agency is serving and adapting to its community [2]. Take, for example, the impact of COVID-19 (which emerged toward the end of Fiscal Year 2020) on both the need for and safety of public transit systems during a temporary public health emergency [3].
As is clearly seen in Figure 1 below, none of the four agencies examined have been unscathed by the pandemic, with all agencies experiencing a drop in ridership between FY2020 and FY2022. For the Greater Richmond Transit Company (GRTC) and Blacksburg Transit (BT), the emergence of the virus interrupted a ridership boom; but for CAT and Arlington Transit (ART), ridership was already declining.

Figure 1: 2015-2023 Ridership and Percent Change trends for 4 VA transit agencies [4]
It’s important to note that, as can be seen in Figure 2, CAT’s ridership has consistently declined over the past ten years. In fact, following the trend established before the pandemic and removing the anomalous pandemic years, FY2023’s ridership appears to align with the already-significantly declining ridership trend that the agency was experiencing before the pandemic, in contrast with the other agencies’ ridership trends.
The fact that CAT’s current ridership is less than half that of 2015 underscores an important reality: CAT’s persistent difficulty in attracting and retaining riders is caused by factors that predate COVID-related service changes and ridership impacts. It’s prudent to note that all four of the transit agencies examined here have adopted free (or, in the case of ART, free or subsidized for some residents) fares in order to stimulate ridership increases. In the wake of the pandemic, CAT, GRTC and BT made use of Virginia’s 2020 Transit Ridership Incentive Program (TRIP) that allowed transit agencies to pilot a free-fare system, which likely prevented the ridership decreases from being even worse [5]. Combined, free fares and significant service improvements are powerful tools to attain the ridership increase that CAT needs to match its peers in getting back to and beyond 2015 ridership numbers [6].

Figure 2: 2015, 2019, 2023 and estimated 2024 Ridership and Percent Change trends for 4 VA transit agencies [7]
Numbers beyond counting: strategies for success
Transit-Oriented Development and Smart Growth
In offering an explanation for Blacksburg Transit’s ridership boom and relatively quick recovery from the impacts of COVID, BT’s Intelligent Transportation Systems (ITS) Manager Tim Witten told C3 that a huge part of their “formula for success” in attracting and retaining ridership is Blacksburg’s “40 years [of] progressive planning[:] you build apartments where BT service exists already; you don't build apartments where there's not BT service” [8].
This type of urban planning is known as “Transit-Oriented Development” (TOD), where zoning for higher-density, compact and mixed-used developments designed for areas that are already served by public transit [9]. The Federal Transit Administration, responsible for the disbursement of Federal competitive and non-competitive funding for transit, is actively encouraging cities to pursue TOD-centered solutions in their planning, also described as “smart growth” [10]. There are increasing funding opportunities available for TOD that address the needs of unhoused community members, with the FTA noting that “when done right, TOD leads to more equitable communities” [11].
Regional Transit Partnerships
In the Greater Richmond area, GRTC’s Chief of Staff Adrienne Torres explained to C3 that for them, one benefit of being a regional entity (encompassing nine jurisdictions) is the expansion of the agency’s overall “footprint”, allowing them to access a higher amount of population-based formula funding [12]. While this non-discretionary formula funding is typically not described as “competitive” [13], it could arguably be interpreted as such, as the choice to create a regional transit partnership or authority (RTP/RTA) allows for an increased apportionment from that year’s formula funding pot [14].
An additional benefit of that expansion is that GRTC can be more ambitious in going after all possible grant funding to meet planning needs: by working closely with regions under the partnership, Torres says she is able to get greater “buy-in” from local leaders, who can provide support letters that strengthen GRTC’s grant applications [15].
Capturing Riders by Choice
In contrast with GRTC’s largely transit-dependent customer base, Arlington County’s Transportation Chief Lynn Rivers described ART’s users to C3 as mostly “choice riders”, meaning that their customer base has other transportation options but chooses to ride transit because of its high service standard [16]. Clinton Edwards, ART’s Transit Manager, added that in many cases their customers even “choose not to own a car because of the robust transit network and offerings that are available” [17].
The need to accommodate and continue attracting these choice riders informs ART’s decisions to offer long service hours, with the first bus entering service at 4:45am and the last bus exiting at 1:39am [18]. Recent feedback from riders showed them that “Arlingtonians [...] want to be able to have robust transit at all times”, and as a result of that customer feedback, ART is working to expand service even further, notably by increasing its revenue hours on weekends [19].
Stepping stones
In order to recover and, indeed, exceed its 2015 ridership high of 2.4 million riders, CAT will need to draw in choice riders with expanded, improved service, alongside a focus on coordination efforts with Charlottesville area development planners to ensure that smart growth and TOD practices help to increase transit ridership [20]. The exciting news is that - as C3 has previously described - CAT’s recently-adopted ten-year Transit Strategic Plan maps out ways that it plans to achieve many of these necessary goals [21].
In next week's blog post, we'll delve deeper into the realm of transit performance evaluation, taking a look into the intricate mechanisms through which agencies' efficiency and effectiveness are adjudged. Join us then as we navigate the nuanced relationships between metrics, like ridership and vehicle revenue hours, that transit agencies like CAT must leverage to secure competitive funding. We'll explore how the criteria are weighed and analyzed to determine an agency's standing in the transit arena - ultimately deciding what share of that year’s pot their agency is allocated. Stay tuned!
Sources
[1] Christopher Berggren (2024), "The Top 10 Benefits of Public Transportation". Available at: https://www.smartcitiesdive.com/ex/sustainablecitiescollective/top-10-benefits-public-transportation/1063096/
[2] Jarrett Walker (2024), "The Transit Ridership Recipe". Available at: https://humantransit.org/basics/the-transit-ridership-recipe
[3] Yi Qi, Jinli Liu, Tao Tao, & Qun Zhao (2023), "Impacts of COVID-19 on public transit ridership - PMC". Available at: https://www.ncbi.nlm.nih.gov/pmc/articles/PMC8611694/
[4] C3-generated charts using FTA agency profile data for 2015, and DRPT data for 2020-2023. More information available on request.
[5] Charlottesville City Council meeting (June 3, 2024), “Charlottesville Area Transit Strategic Plan” presentation. Available at: https://charlottesvilleva.portal.civicclerk.com/event/2028/media (minute mark 00:43:42)
[6] Wyatt Gordon (2024), “One in four Virginia transit agencies operate fare-free, perhaps permanently”. Available at: https://virginiamercury.com/2024/01/17/one-in-four-virginia-transit-agencies-operate-fare-free-perhaps-permanently/
[7] C3-generated charts using FTA agency profile data for FY2015, and DRPT data for FY2019 and FY2023. For C3’s 2024 ridership estimates, the percentage change from available data on DRPT’s FY2024 ridership YTD (June-March 2024) compared to DRPT’s data on June-March 2023 ridership was applied to the total FY2023 ridership, giving an approximate estimate for FY2024. More information available on request.
[8] Tim Witten (Intelligent Transportation Systems Manager, Blacksburg Transit) in conversation with C3, July 18, 2024.
[9] Federal Transit Administration, "Pilot Program for Transit-Oriented Development Planning – Section 20005(b)". Available at: https://www.transit.dot.gov/TODPilot
[10] Federal Transit Administration, "National Resources & Technical Assistance For Transit-Oriented Development". Available at: https://todresources.org/
[11] Federal Transit Administration, "Transit-Oriented Development". Available at: https://www.transit.dot.gov/TOD
[12] Adrienne Torres (Chief of Staff, Greater Richmond Transit Company) in conversation with C3, July 19, 2024.
[13] USDOT, "Federal Funding and Financing: Grants". Available at: https://www.transportation.gov/rural/grant-toolkit/funding-and-financing/grants-overview
[14] Adrienne Torres (Chief of Staff, Greater Richmond Transit Company) in conversation with C3, July 19, 2024.
[15] Adrienne Torres (Chief of Staff, Greater Richmond Transit Company) in conversation with C3, July 19, 2024.
[16] Lynn Rivers (Transportation Chief, Arlington County) in conversation with C3, August 1, 2024.
[17] Clinton Edwards (Transit Manager, Arlington Transit) in conversation with C3, August 1, 2024.
[18] Clinton Edwards (Transit Manager, Arlington Transit) in conversation with C3, August 1, 2024.
[19] Clinton Edwards (Transit Manager, Arlington Transit) in conversation with C3, August 1, 2024.
[20] Charlottesville Area Transit (2024), Transit Strategic Plan. Available at: https://www.charlottesville.gov/DocumentCenter/View/12163/CAT-FINAL-TSP-Chapter-4?bidId=, pp.(2-12)-(2-13)
[21] Sadhbh O’Flynn (2024), “CAT’s 10-year Transit Strategic Plan: Advancing Transportation Justice”. Available at: https://theclimatecollaborative.org/blog/2024/6/13/cats-10-year-transit-strategic-plan-advancing-transportation-justice